
3.1. 화재데이터를 이용한 기초그래프#
앞에서 연도, 시군구별, 사망자수, 부상자수에 대해 가장 높은 지역, 혹은 여름, 겨울의 출동횟수 차이를 비교를 하였다. 또한 이를 수치로 비교하였기에 하나의 값, 혹은 관측값에 대해서만 확인을 하였다.
이러한 내용을 한꺼번에 비교를 하고 싶을때도 있다. 이럴때 가장 많이 사용하는 방법이 시각화이다. 즉, 시각화는 많은 정보를 그림으로 나타내어 한번에 그 정보들을 확인할 수 있게 만들어준다. 파이썬에서는 그래프를 그리기 위해 matplotlib패키지를 이용한다.
하지만 코랩에서는 기본적으로 한국어를 지원하지 않기 때문에 한국어 폰트를 설치를 해줘야 한다. 이를 설치하기 위해 아래의 코드를 실행시킨다.
!sudo apt-get install -y fonts-nanum
!sudo fc-cache -fv
!rm ~/.cache/matplotlib -rf
'sudo'은(는) 내부 또는 외부 명령, 실행할 수 있는 프로그램, 또는
배치 파일이 아닙니다.
'sudo'은(는) 내부 또는 외부 명령, 실행할 수 있는 프로그램, 또는
배치 파일이 아닙니다.
'rm'은(는) 내부 또는 외부 명령, 실행할 수 있는 프로그램, 또는
배치 파일이 아닙니다.
위 코드는 코랩에 나눔폰트를 설치해주는 코드이다. 이를 실행하고, 상단에 런타임 > 런타임 다시 시작 을 클릭한다.
그 후, 파이썬에서 나눔폰트를 사용한다는 의미로 plt.rcParams를 이용한다.
import pandas as pd
import matplotlib.pyplot as plt

plt.rcParams['font.family'] = 'NanumBarunGothic'
데이터 읽기#
pandas패키지를 이용하여 practice_dat 엑셀파일을 읽는다.
final_dat = pd.read_csv("https://uos-bigdata.github.io/lab_data/docs/assets/data_lab_fire/practice_dat.csv")
final_dat.head()
| 화재발생연도 | 시군구 | 사망자수 | 부상자수 | 재산피해금액 | 총출동횟수 | 출동횟수_여름 | 출동횟수_겨울 | |
|---|---|---|---|---|---|---|---|---|
| 0 | 2017 | 강남구 | 0 | 11 | 1565258 | 502 | 120 | 129 |
| 1 | 2017 | 강동구 | 0 | 12 | 418593 | 269 | 73 | 63 |
| 2 | 2017 | 강북구 | 0 | 6 | 339146 | 186 | 41 | 51 |
| 3 | 2017 | 강서구 | 3 | 22 | 706871 | 364 | 81 | 89 |
| 4 | 2017 | 관악구 | 3 | 20 | 654690 | 286 | 69 | 82 |
이 데이터를 이용하여 기본 그래프의 기본인 막대 그래프, 선 그래프, 산점도, 파이 차트 4가지를 소개한다.
막대 그래프#
2021년 시군구별 사망자 수#
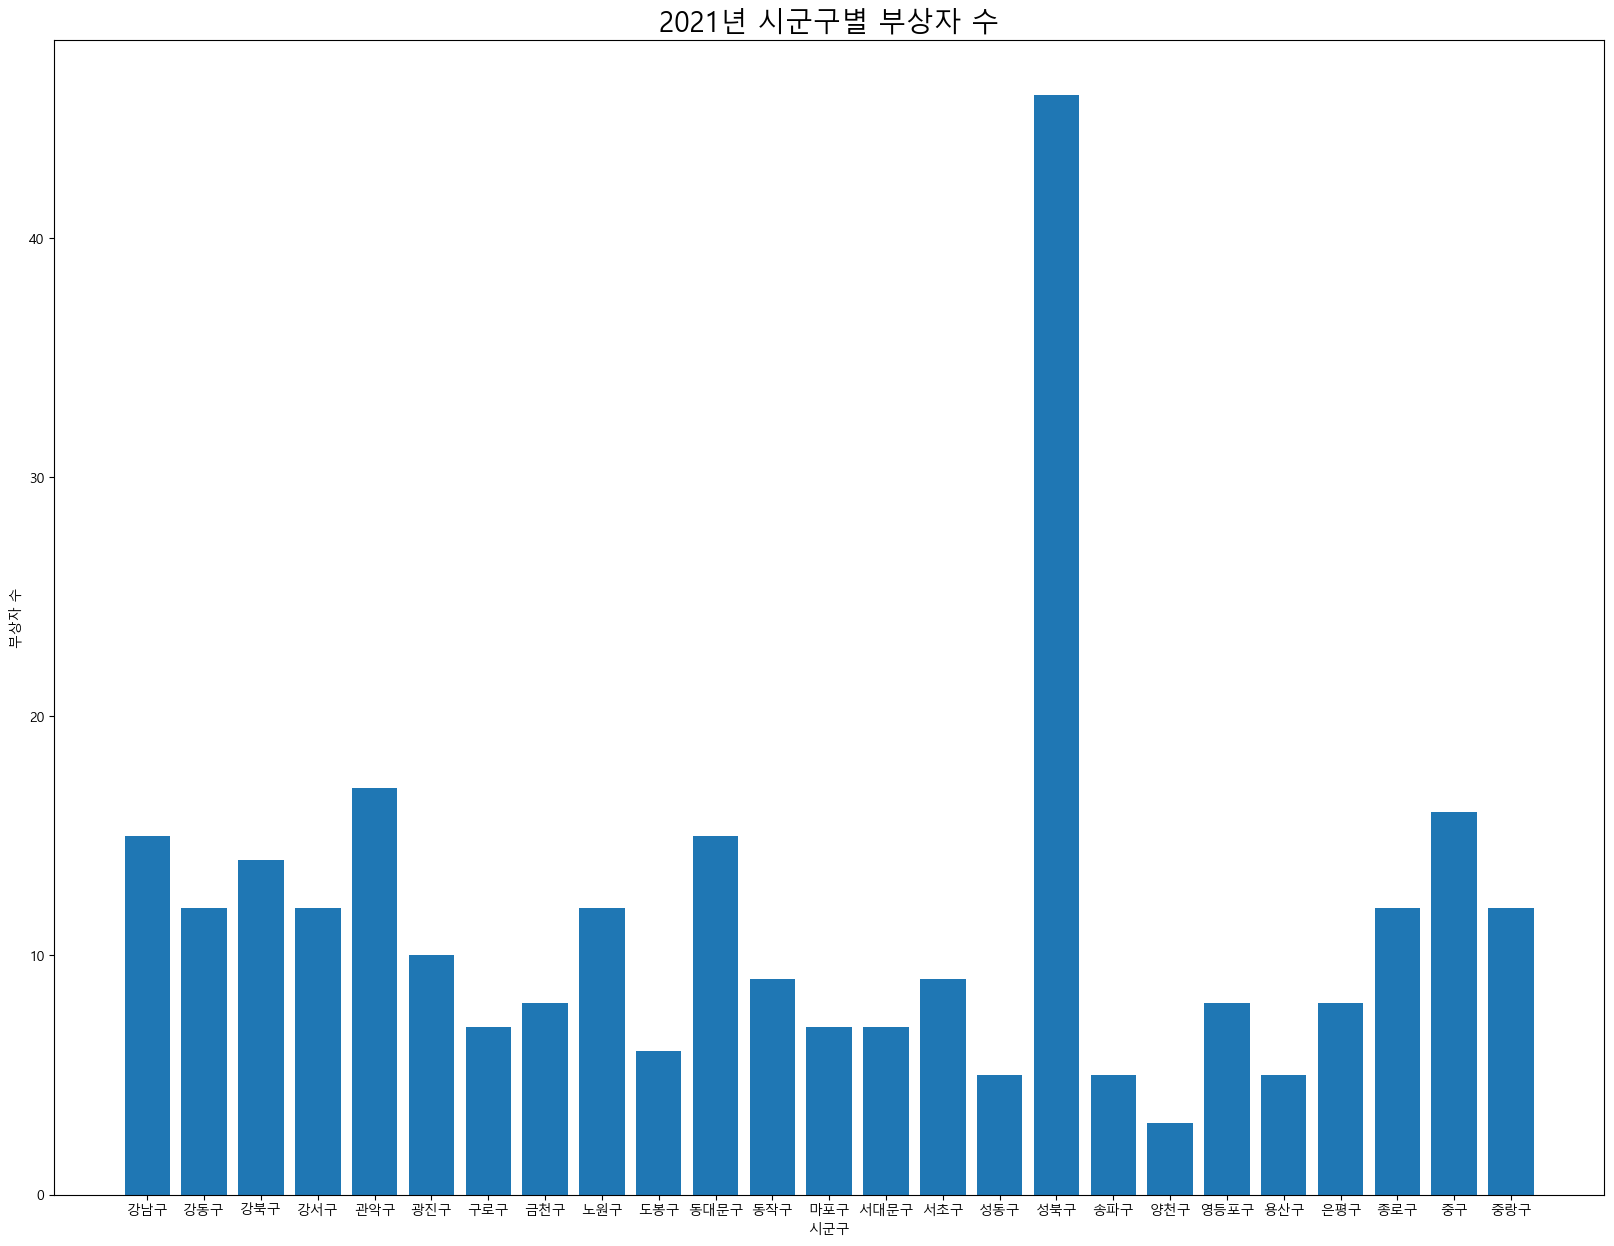
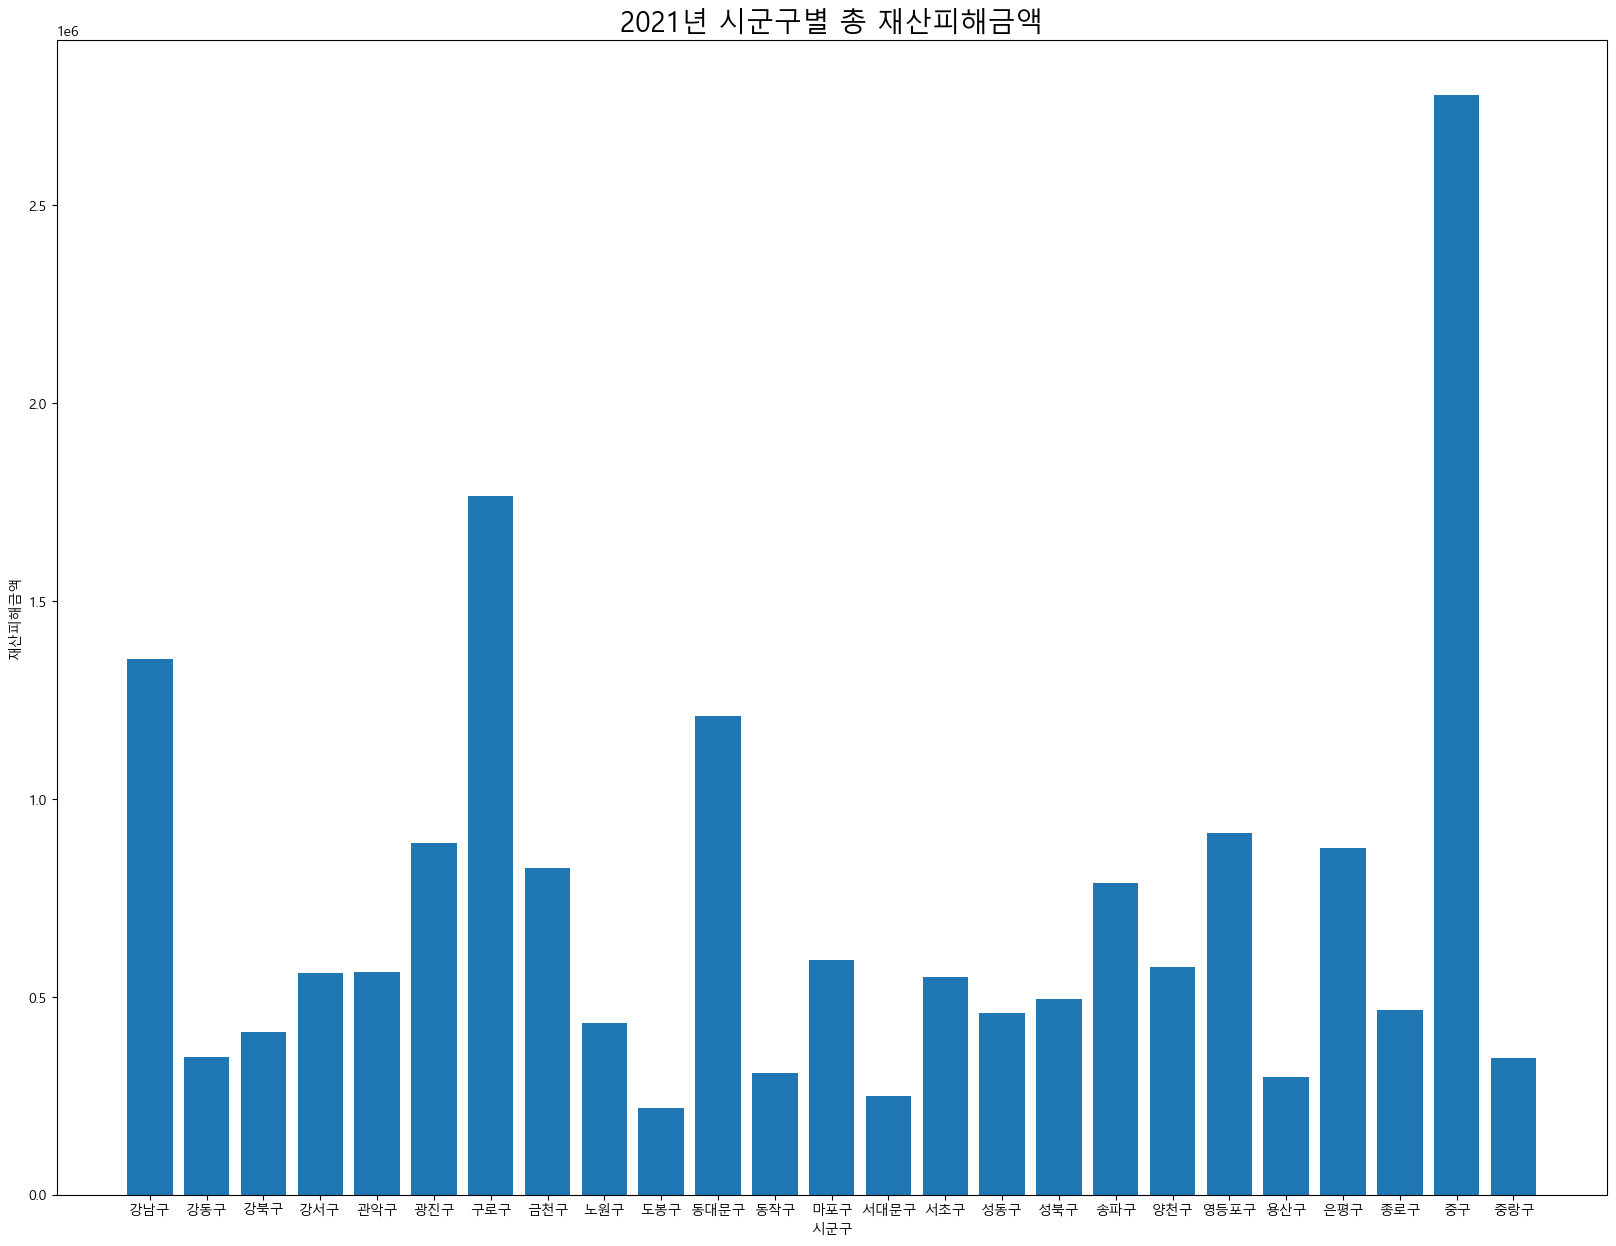
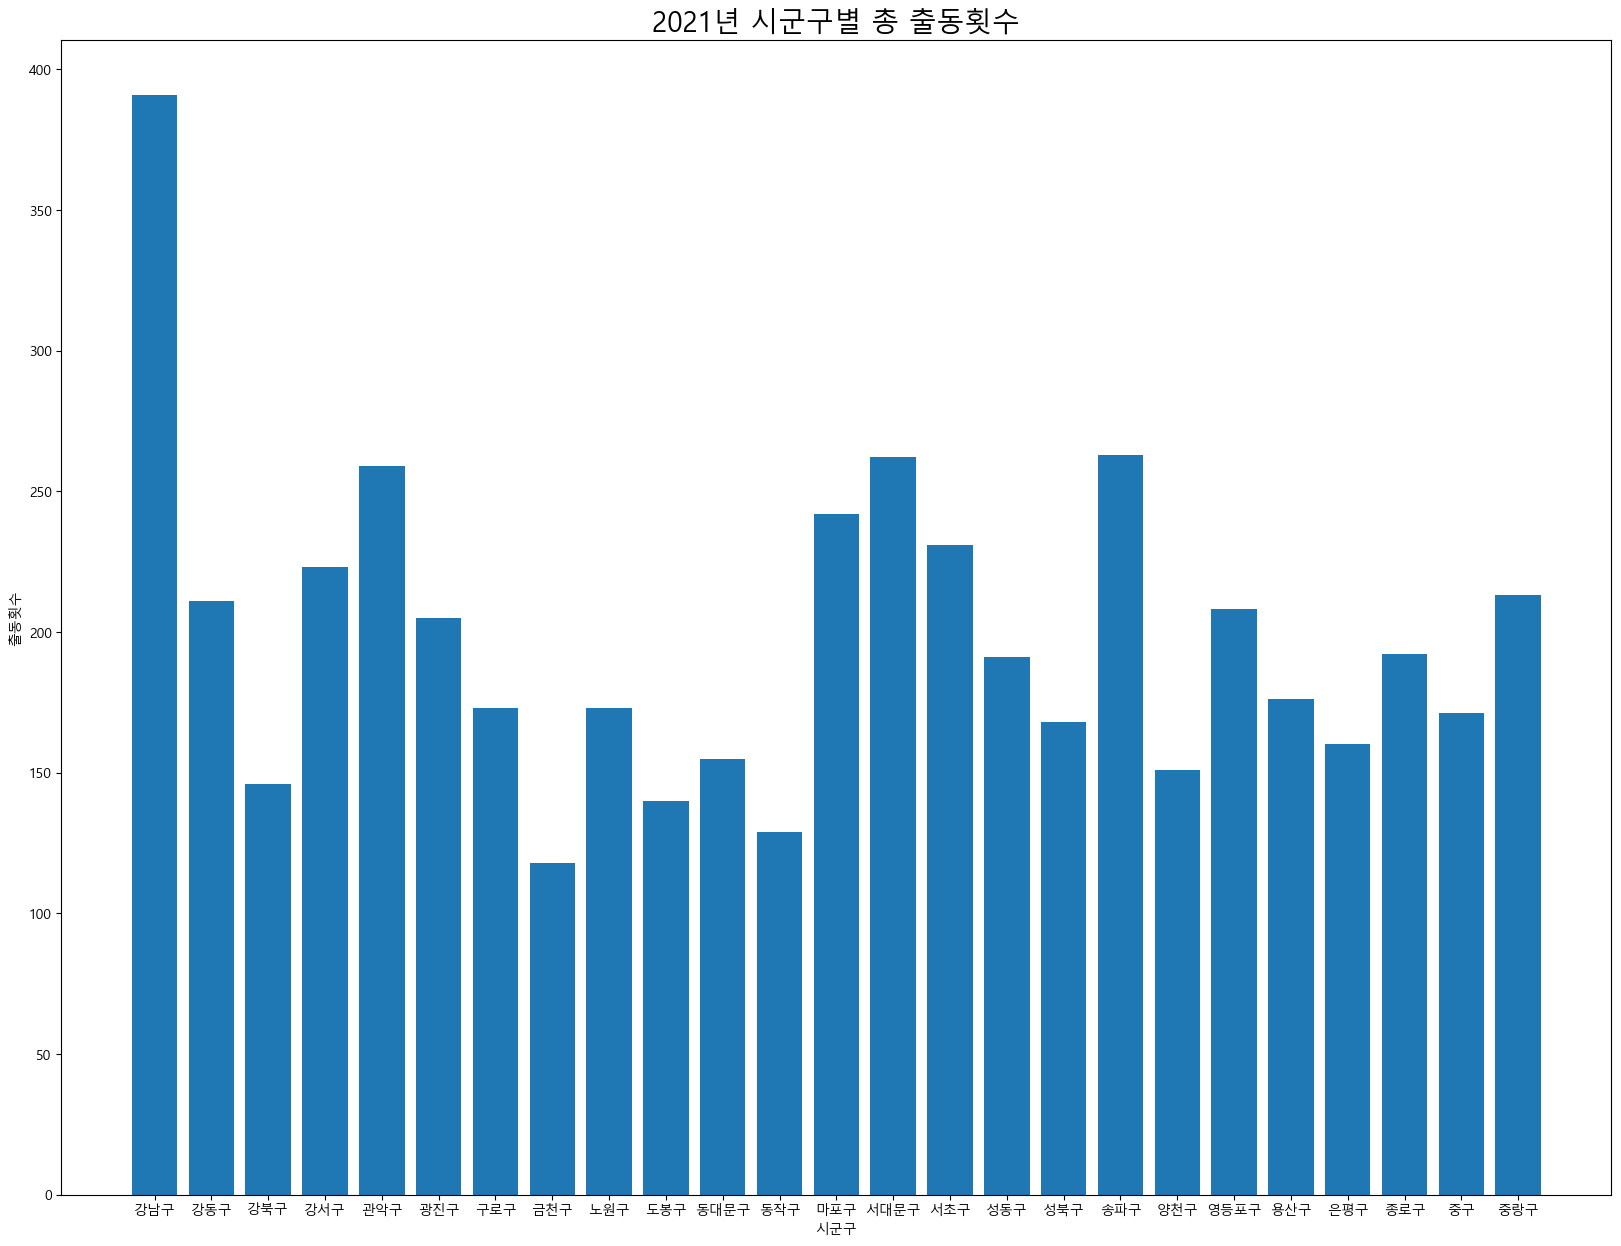
앞에서 2021년에 사망자수, 부상자수, 재산피해금액, 총출동횟수가 가장 높은 지역은 강북구, 성북구, 중구, 강남구임을 확인했었는데, 이를 막대그래프로 확인해보자.
위 데이터는 이미 연도별, 시군구별로 변수들의 총 합을 계산해놓은 데이터이다. 그러므로 2021년의 데이터만 추출해보자.
tmp_ind = final_dat["화재발생연도"] == 2021
sub_dat = final_dat.loc[tmp_ind, :]
sub_dat.head()
| 화재발생연도 | 시군구 | 사망자수 | 부상자수 | 재산피해금액 | 총출동횟수 | 출동횟수_여름 | 출동횟수_겨울 | |
|---|---|---|---|---|---|---|---|---|
| 100 | 2021 | 강남구 | 2 | 15 | 1354949 | 391 | 91 | 112 |
| 101 | 2021 | 강동구 | 1 | 12 | 346741 | 211 | 45 | 56 |
| 102 | 2021 | 강북구 | 5 | 14 | 410205 | 146 | 38 | 29 |
| 103 | 2021 | 강서구 | 2 | 12 | 559614 | 223 | 50 | 61 |
| 104 | 2021 | 관악구 | 2 | 17 | 562294 | 259 | 54 | 74 |
그래프를 그리기위해, figure함수를 이용하여 그래프의 크기를 정합니다. 이후, bar함수를 이용해 x축에는 시군구 변수, y축에는 사망자수변수를 넣고 그래프를 생성합니다.
plt.title : 그래프에서 제목을 결정하는 함수
plt.xlabel : x축의 이름을 결정하는 함수
plt.ylabel : y축의 이름을 결정하는 함수
plt.show() : 그림을 출력해주는 함수
fig = plt.figure(figsize=(20, 15))
plt.bar("시군구", "사망자수", data = sub_dat)

plt.title('2021년 시군구별 사망자 수',fontsize=20)
plt.xlabel('시군구')
plt.ylabel('사망자 수')

plt.show()
findfont: Font family 'NanumBarunGothic' not found.
findfont: Font family 'NanumBarunGothic' not found.
findfont: Font family 'NanumBarunGothic' not found.
findfont: Font family 'NanumBarunGothic' not found.
findfont: Font family 'NanumBarunGothic' not found.
findfont: Font family 'NanumBarunGothic' not found.
findfont: Font family 'NanumBarunGothic' not found.
findfont: Font family 'NanumBarunGothic' not found.
D:\anaconda3\lib\site-packages\IPython\core\pylabtools.py:152: UserWarning: Glyph 49324 (\N{HANGUL SYLLABLE SA}) missing from current font.
  fig.canvas.print_figure(bytes_io, **kw)
D:\anaconda3\lib\site-packages\IPython\core\pylabtools.py:152: UserWarning: Glyph 47581 (\N{HANGUL SYLLABLE MANG}) missing from current font.
  fig.canvas.print_figure(bytes_io, **kw)
D:\anaconda3\lib\site-packages\IPython\core\pylabtools.py:152: UserWarning: Glyph 51088 (\N{HANGUL SYLLABLE JA}) missing from current font.
  fig.canvas.print_figure(bytes_io, **kw)
D:\anaconda3\lib\site-packages\IPython\core\pylabtools.py:152: UserWarning: Glyph 49688 (\N{HANGUL SYLLABLE SU}) missing from current font.
  fig.canvas.print_figure(bytes_io, **kw)
findfont: Font family 'NanumBarunGothic' not found.
findfont: Font family 'NanumBarunGothic' not found.
D:\anaconda3\lib\site-packages\IPython\core\pylabtools.py:152: UserWarning: Glyph 45380 (\N{HANGUL SYLLABLE NYEON}) missing from current font.
  fig.canvas.print_figure(bytes_io, **kw)
D:\anaconda3\lib\site-packages\IPython\core\pylabtools.py:152: UserWarning: Glyph 49884 (\N{HANGUL SYLLABLE SI}) missing from current font.
  fig.canvas.print_figure(bytes_io, **kw)
D:\anaconda3\lib\site-packages\IPython\core\pylabtools.py:152: UserWarning: Glyph 44400 (\N{HANGUL SYLLABLE GUN}) missing from current font.
  fig.canvas.print_figure(bytes_io, **kw)
D:\anaconda3\lib\site-packages\IPython\core\pylabtools.py:152: UserWarning: Glyph 44396 (\N{HANGUL SYLLABLE GU}) missing from current font.
  fig.canvas.print_figure(bytes_io, **kw)
D:\anaconda3\lib\site-packages\IPython\core\pylabtools.py:152: UserWarning: Glyph 48324 (\N{HANGUL SYLLABLE BYEOL}) missing from current font.
  fig.canvas.print_figure(bytes_io, **kw)
findfont: Font family 'NanumBarunGothic' not found.
D:\anaconda3\lib\site-packages\IPython\core\pylabtools.py:152: UserWarning: Glyph 44053 (\N{HANGUL SYLLABLE GANG}) missing from current font.
  fig.canvas.print_figure(bytes_io, **kw)
D:\anaconda3\lib\site-packages\IPython\core\pylabtools.py:152: UserWarning: Glyph 45224 (\N{HANGUL SYLLABLE NAM}) missing from current font.
  fig.canvas.print_figure(bytes_io, **kw)
findfont: Font family 'NanumBarunGothic' not found.
D:\anaconda3\lib\site-packages\IPython\core\pylabtools.py:152: UserWarning: Glyph 46041 (\N{HANGUL SYLLABLE DONG}) missing from current font.
  fig.canvas.print_figure(bytes_io, **kw)
findfont: Font family 'NanumBarunGothic' not found.
D:\anaconda3\lib\site-packages\IPython\core\pylabtools.py:152: UserWarning: Glyph 48513 (\N{HANGUL SYLLABLE BUG}) missing from current font.
  fig.canvas.print_figure(bytes_io, **kw)
findfont: Font family 'NanumBarunGothic' not found.
D:\anaconda3\lib\site-packages\IPython\core\pylabtools.py:152: UserWarning: Glyph 49436 (\N{HANGUL SYLLABLE SEO}) missing from current font.
  fig.canvas.print_figure(bytes_io, **kw)
findfont: Font family 'NanumBarunGothic' not found.
D:\anaconda3\lib\site-packages\IPython\core\pylabtools.py:152: UserWarning: Glyph 44288 (\N{HANGUL SYLLABLE GWAN}) missing from current font.
  fig.canvas.print_figure(bytes_io, **kw)
D:\anaconda3\lib\site-packages\IPython\core\pylabtools.py:152: UserWarning: Glyph 50501 (\N{HANGUL SYLLABLE AG}) missing from current font.
  fig.canvas.print_figure(bytes_io, **kw)
findfont: Font family 'NanumBarunGothic' not found.
D:\anaconda3\lib\site-packages\IPython\core\pylabtools.py:152: UserWarning: Glyph 44305 (\N{HANGUL SYLLABLE GWANG}) missing from current font.
  fig.canvas.print_figure(bytes_io, **kw)
D:\anaconda3\lib\site-packages\IPython\core\pylabtools.py:152: UserWarning: Glyph 51652 (\N{HANGUL SYLLABLE JIN}) missing from current font.
  fig.canvas.print_figure(bytes_io, **kw)
findfont: Font family 'NanumBarunGothic' not found.
D:\anaconda3\lib\site-packages\IPython\core\pylabtools.py:152: UserWarning: Glyph 47196 (\N{HANGUL SYLLABLE RO}) missing from current font.
  fig.canvas.print_figure(bytes_io, **kw)
findfont: Font family 'NanumBarunGothic' not found.
D:\anaconda3\lib\site-packages\IPython\core\pylabtools.py:152: UserWarning: Glyph 44552 (\N{HANGUL SYLLABLE GEUM}) missing from current font.
  fig.canvas.print_figure(bytes_io, **kw)
D:\anaconda3\lib\site-packages\IPython\core\pylabtools.py:152: UserWarning: Glyph 52380 (\N{HANGUL SYLLABLE CEON}) missing from current font.
  fig.canvas.print_figure(bytes_io, **kw)
findfont: Font family 'NanumBarunGothic' not found.
D:\anaconda3\lib\site-packages\IPython\core\pylabtools.py:152: UserWarning: Glyph 45432 (\N{HANGUL SYLLABLE NO}) missing from current font.
  fig.canvas.print_figure(bytes_io, **kw)
D:\anaconda3\lib\site-packages\IPython\core\pylabtools.py:152: UserWarning: Glyph 50896 (\N{HANGUL SYLLABLE WEON}) missing from current font.
  fig.canvas.print_figure(bytes_io, **kw)
findfont: Font family 'NanumBarunGothic' not found.
D:\anaconda3\lib\site-packages\IPython\core\pylabtools.py:152: UserWarning: Glyph 46020 (\N{HANGUL SYLLABLE DO}) missing from current font.
  fig.canvas.print_figure(bytes_io, **kw)
D:\anaconda3\lib\site-packages\IPython\core\pylabtools.py:152: UserWarning: Glyph 48393 (\N{HANGUL SYLLABLE BONG}) missing from current font.
  fig.canvas.print_figure(bytes_io, **kw)
findfont: Font family 'NanumBarunGothic' not found.
D:\anaconda3\lib\site-packages\IPython\core\pylabtools.py:152: UserWarning: Glyph 45824 (\N{HANGUL SYLLABLE DAE}) missing from current font.
  fig.canvas.print_figure(bytes_io, **kw)
D:\anaconda3\lib\site-packages\IPython\core\pylabtools.py:152: UserWarning: Glyph 47928 (\N{HANGUL SYLLABLE MUN}) missing from current font.
  fig.canvas.print_figure(bytes_io, **kw)
findfont: Font family 'NanumBarunGothic' not found.
D:\anaconda3\lib\site-packages\IPython\core\pylabtools.py:152: UserWarning: Glyph 51089 (\N{HANGUL SYLLABLE JAG}) missing from current font.
  fig.canvas.print_figure(bytes_io, **kw)
findfont: Font family 'NanumBarunGothic' not found.
D:\anaconda3\lib\site-packages\IPython\core\pylabtools.py:152: UserWarning: Glyph 47560 (\N{HANGUL SYLLABLE MA}) missing from current font.
  fig.canvas.print_figure(bytes_io, **kw)
D:\anaconda3\lib\site-packages\IPython\core\pylabtools.py:152: UserWarning: Glyph 54252 (\N{HANGUL SYLLABLE PO}) missing from current font.
  fig.canvas.print_figure(bytes_io, **kw)
findfont: Font family 'NanumBarunGothic' not found.
findfont: Font family 'NanumBarunGothic' not found.
D:\anaconda3\lib\site-packages\IPython\core\pylabtools.py:152: UserWarning: Glyph 52488 (\N{HANGUL SYLLABLE CO}) missing from current font.
  fig.canvas.print_figure(bytes_io, **kw)
findfont: Font family 'NanumBarunGothic' not found.
D:\anaconda3\lib\site-packages\IPython\core\pylabtools.py:152: UserWarning: Glyph 49457 (\N{HANGUL SYLLABLE SEONG}) missing from current font.
  fig.canvas.print_figure(bytes_io, **kw)
findfont: Font family 'NanumBarunGothic' not found.
findfont: Font family 'NanumBarunGothic' not found.
D:\anaconda3\lib\site-packages\IPython\core\pylabtools.py:152: UserWarning: Glyph 49569 (\N{HANGUL SYLLABLE SONG}) missing from current font.
  fig.canvas.print_figure(bytes_io, **kw)
D:\anaconda3\lib\site-packages\IPython\core\pylabtools.py:152: UserWarning: Glyph 54028 (\N{HANGUL SYLLABLE PA}) missing from current font.
  fig.canvas.print_figure(bytes_io, **kw)
findfont: Font family 'NanumBarunGothic' not found.
D:\anaconda3\lib\site-packages\IPython\core\pylabtools.py:152: UserWarning: Glyph 50577 (\N{HANGUL SYLLABLE YANG}) missing from current font.
  fig.canvas.print_figure(bytes_io, **kw)
findfont: Font family 'NanumBarunGothic' not found.
D:\anaconda3\lib\site-packages\IPython\core\pylabtools.py:152: UserWarning: Glyph 50689 (\N{HANGUL SYLLABLE YEONG}) missing from current font.
  fig.canvas.print_figure(bytes_io, **kw)
D:\anaconda3\lib\site-packages\IPython\core\pylabtools.py:152: UserWarning: Glyph 46321 (\N{HANGUL SYLLABLE DEUNG}) missing from current font.
  fig.canvas.print_figure(bytes_io, **kw)
findfont: Font family 'NanumBarunGothic' not found.
D:\anaconda3\lib\site-packages\IPython\core\pylabtools.py:152: UserWarning: Glyph 50857 (\N{HANGUL SYLLABLE YONG}) missing from current font.
  fig.canvas.print_figure(bytes_io, **kw)
D:\anaconda3\lib\site-packages\IPython\core\pylabtools.py:152: UserWarning: Glyph 49328 (\N{HANGUL SYLLABLE SAN}) missing from current font.
  fig.canvas.print_figure(bytes_io, **kw)
findfont: Font family 'NanumBarunGothic' not found.
D:\anaconda3\lib\site-packages\IPython\core\pylabtools.py:152: UserWarning: Glyph 51008 (\N{HANGUL SYLLABLE EUN}) missing from current font.
  fig.canvas.print_figure(bytes_io, **kw)
D:\anaconda3\lib\site-packages\IPython\core\pylabtools.py:152: UserWarning: Glyph 54217 (\N{HANGUL SYLLABLE PYEONG}) missing from current font.
  fig.canvas.print_figure(bytes_io, **kw)
findfont: Font family 'NanumBarunGothic' not found.
D:\anaconda3\lib\site-packages\IPython\core\pylabtools.py:152: UserWarning: Glyph 51333 (\N{HANGUL SYLLABLE JONG}) missing from current font.
  fig.canvas.print_figure(bytes_io, **kw)
findfont: Font family 'NanumBarunGothic' not found.
D:\anaconda3\lib\site-packages\IPython\core\pylabtools.py:152: UserWarning: Glyph 51473 (\N{HANGUL SYLLABLE JUNG}) missing from current font.
  fig.canvas.print_figure(bytes_io, **kw)
findfont: Font family 'NanumBarunGothic' not found.
D:\anaconda3\lib\site-packages\IPython\core\pylabtools.py:152: UserWarning: Glyph 46993 (\N{HANGUL SYLLABLE RANG}) missing from current font.
  fig.canvas.print_figure(bytes_io, **kw)
findfont: Font family 'NanumBarunGothic' not found.
findfont: Font family 'NanumBarunGothic' not found.
findfont: Font family 'NanumBarunGothic' not found.
findfont: Font family 'NanumBarunGothic' not found.
findfont: Font family 'NanumBarunGothic' not found.
findfont: Font family 'NanumBarunGothic' not found.
findfont: Font family 'NanumBarunGothic' not found.
findfont: Font family 'NanumBarunGothic' not found.
findfont: Font family 'NanumBarunGothic' not found.
findfont: Font family 'NanumBarunGothic' not found.
findfont: Font family 'NanumBarunGothic' not found.
findfont: Font family 'NanumBarunGothic' not found.
findfont: Font family 'NanumBarunGothic' not found.
findfont: Font family 'NanumBarunGothic' not found.
findfont: Font family 'NanumBarunGothic' not found.
findfont: Font family 'NanumBarunGothic' not found.
findfont: Font family 'NanumBarunGothic' not found.
findfont: Font family 'NanumBarunGothic' not found.
findfont: Font family 'NanumBarunGothic' not found.
findfont: Font family 'NanumBarunGothic' not found.
findfont: Font family 'NanumBarunGothic' not found.
findfont: Font family 'NanumBarunGothic' not found.
findfont: Font family 'NanumBarunGothic' not found.
findfont: Font family 'NanumBarunGothic' not found.
findfont: Font family 'NanumBarunGothic' not found.
findfont: Font family 'NanumBarunGothic' not found.
findfont: Font family 'NanumBarunGothic' not found.
findfont: Font family 'NanumBarunGothic' not found.
findfont: Font family 'NanumBarunGothic' not found.
findfont: Font family 'NanumBarunGothic' not found.
findfont: Font family 'NanumBarunGothic' not found.
findfont: Font family 'NanumBarunGothic' not found.
findfont: Font family 'NanumBarunGothic' not found.
findfont: Font family 'NanumBarunGothic' not found.
findfont: Font family 'NanumBarunGothic' not found.
findfont: Font family 'NanumBarunGothic' not found.
findfont: Font family 'NanumBarunGothic' not found.
findfont: Font family 'NanumBarunGothic' not found.
findfont: Font family 'NanumBarunGothic' not found.
findfont: Font family 'NanumBarunGothic' not found.
findfont: Font family 'NanumBarunGothic' not found.
findfont: Font family 'NanumBarunGothic' not found.
findfont: Font family 'NanumBarunGothic' not found.
findfont: Font family 'NanumBarunGothic' not found.
findfont: Font family 'NanumBarunGothic' not found.
findfont: Font family 'NanumBarunGothic' not found.
findfont: Font family 'NanumBarunGothic' not found.
findfont: Font family 'NanumBarunGothic' not found.
findfont: Font family 'NanumBarunGothic' not found.
findfont: Font family 'NanumBarunGothic' not found.
findfont: Font family 'NanumBarunGothic' not found.
findfont: Font family 'NanumBarunGothic' not found.
findfont: Font family 'NanumBarunGothic' not found.
findfont: Font family 'NanumBarunGothic' not found.
findfont: Font family 'NanumBarunGothic' not found.
findfont: Font family 'NanumBarunGothic' not found.
findfont: Font family 'NanumBarunGothic' not found.
findfont: Font family 'NanumBarunGothic' not found.
findfont: Font family 'NanumBarunGothic' not found.
findfont: Font family 'NanumBarunGothic' not found.
findfont: Font family 'NanumBarunGothic' not found.
findfont: Font family 'NanumBarunGothic' not found.
findfont: Font family 'NanumBarunGothic' not found.
findfont: Font family 'NanumBarunGothic' not found.
findfont: Font family 'NanumBarunGothic' not found.
findfont: Font family 'NanumBarunGothic' not found.
findfont: Font family 'NanumBarunGothic' not found.
findfont: Font family 'NanumBarunGothic' not found.
findfont: Font family 'NanumBarunGothic' not found.
findfont: Font family 'NanumBarunGothic' not found.
findfont: Font family 'NanumBarunGothic' not found.
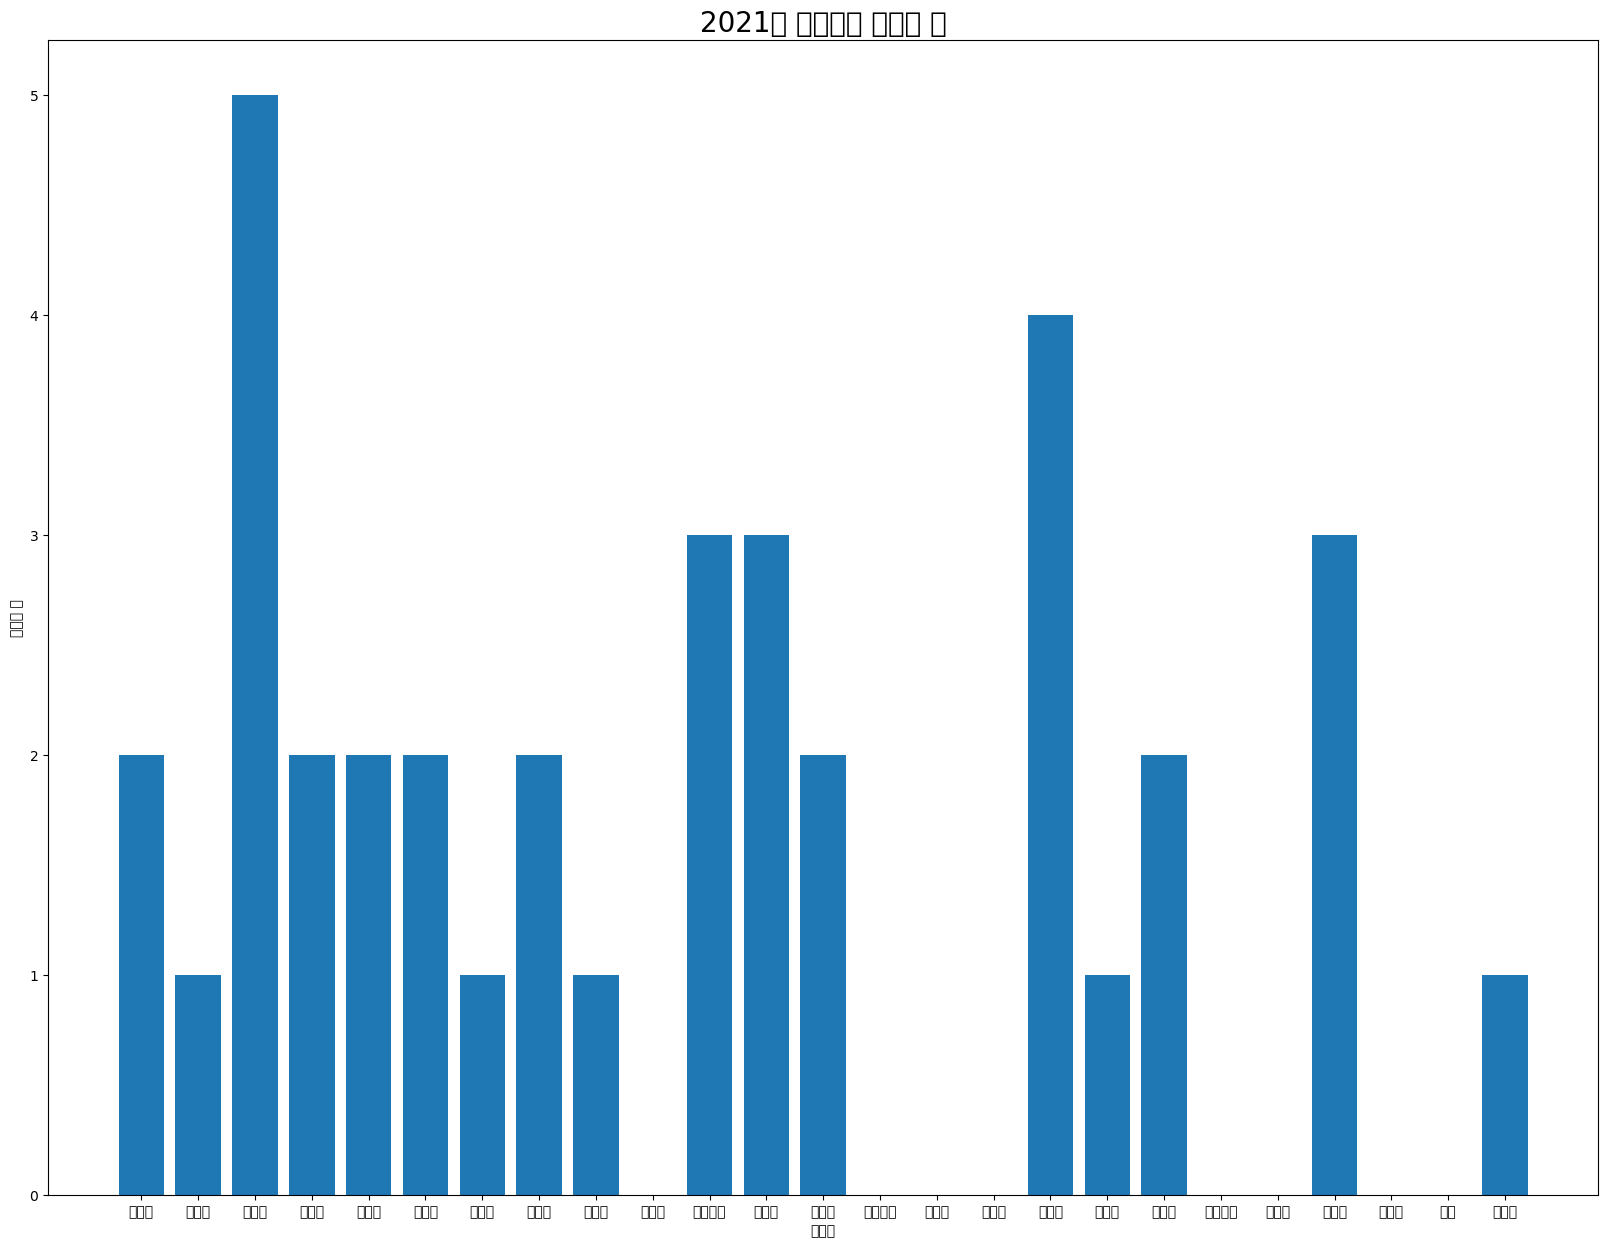
앞서 확인한 결과처럼 강북구에서 가장 사망자수가 가장 높다는 것을 알수 있다. 추가적으로 성북구가 4명으로 두 번째, 은평구, 동대문구, 동작구들이 3명으로 3번째로 높다는 것을 확인 할 수 있다.
같은 방법으로 부상자수, 재산피해금액, 총 출동횟수를 각각 막대그래프로 시각화한 결과는 아래와 같다.
2021년 시군구별 부상자 수#
fig = plt.figure(figsize=(20, 15))
plt.bar("시군구", "부상자수", data = sub_dat)

plt.title('2021년 시군구별 부상자 수',fontsize=20)
plt.xlabel('시군구')
plt.ylabel('부상자 수')

plt.show()
2021년 시군구별 재산피해금액#
fig = plt.figure(figsize=(20, 15))
plt.bar("시군구", "재산피해금액", data = sub_dat)

plt.title('2021년 시군구별 총 재산피해금액',fontsize=20)
plt.xlabel('시군구')
plt.ylabel('재산피해금액')

plt.show()
2021년 시군구별 총 출동횟수#
fig = plt.figure(figsize=(20, 15))
plt.bar("시군구", "총출동횟수", data = sub_dat)

plt.title('2021년 시군구별 총 출동횟수',fontsize=20) ## 타이틀
plt.xlabel('시군구')
plt.ylabel('출동횟수')

plt.show()
선 그래프#
선 그래프는 시간의 흐름 혹은 여러 색상을 이용하여 표현 할 때, 많이 이용되는 그래프이다.
5년 동안 서울시 총 출동횟수#
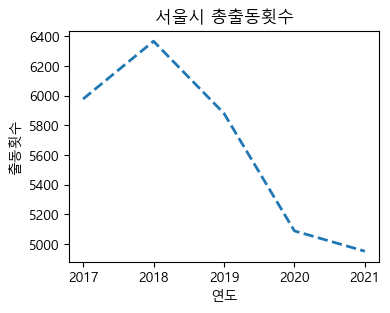
선 그래프의 첫번째 예시로 연도별 서울시 총 출동횟수를 그려보자. 이를 위해, 처음 읽었던 데이터를 연도별로 총 출동 횟수를 계산해보자.
sum_dat = final_dat.groupby("화재발생연도")["총출동횟수"].agg('sum')
sum_dat = sum_dat.reset_index()
sum_dat
| 화재발생연도 | 총출동횟수 | |
|---|---|---|
| 0 | 2017 | 5978 |
| 1 | 2018 | 6368 |
| 2 | 2019 | 5881 |
| 3 | 2020 | 5088 |
| 4 | 2021 | 4951 |
fig = plt.figure(figsize=(4, 3))

plt.plot(sum_dat["화재발생연도"], sum_dat["총출동횟수"], linestyle ="--", linewidth = 2)

plt.title('서울시 총출동횟수')
plt.xlabel('연도')
plt.ylabel('출동횟수')
plt.show()
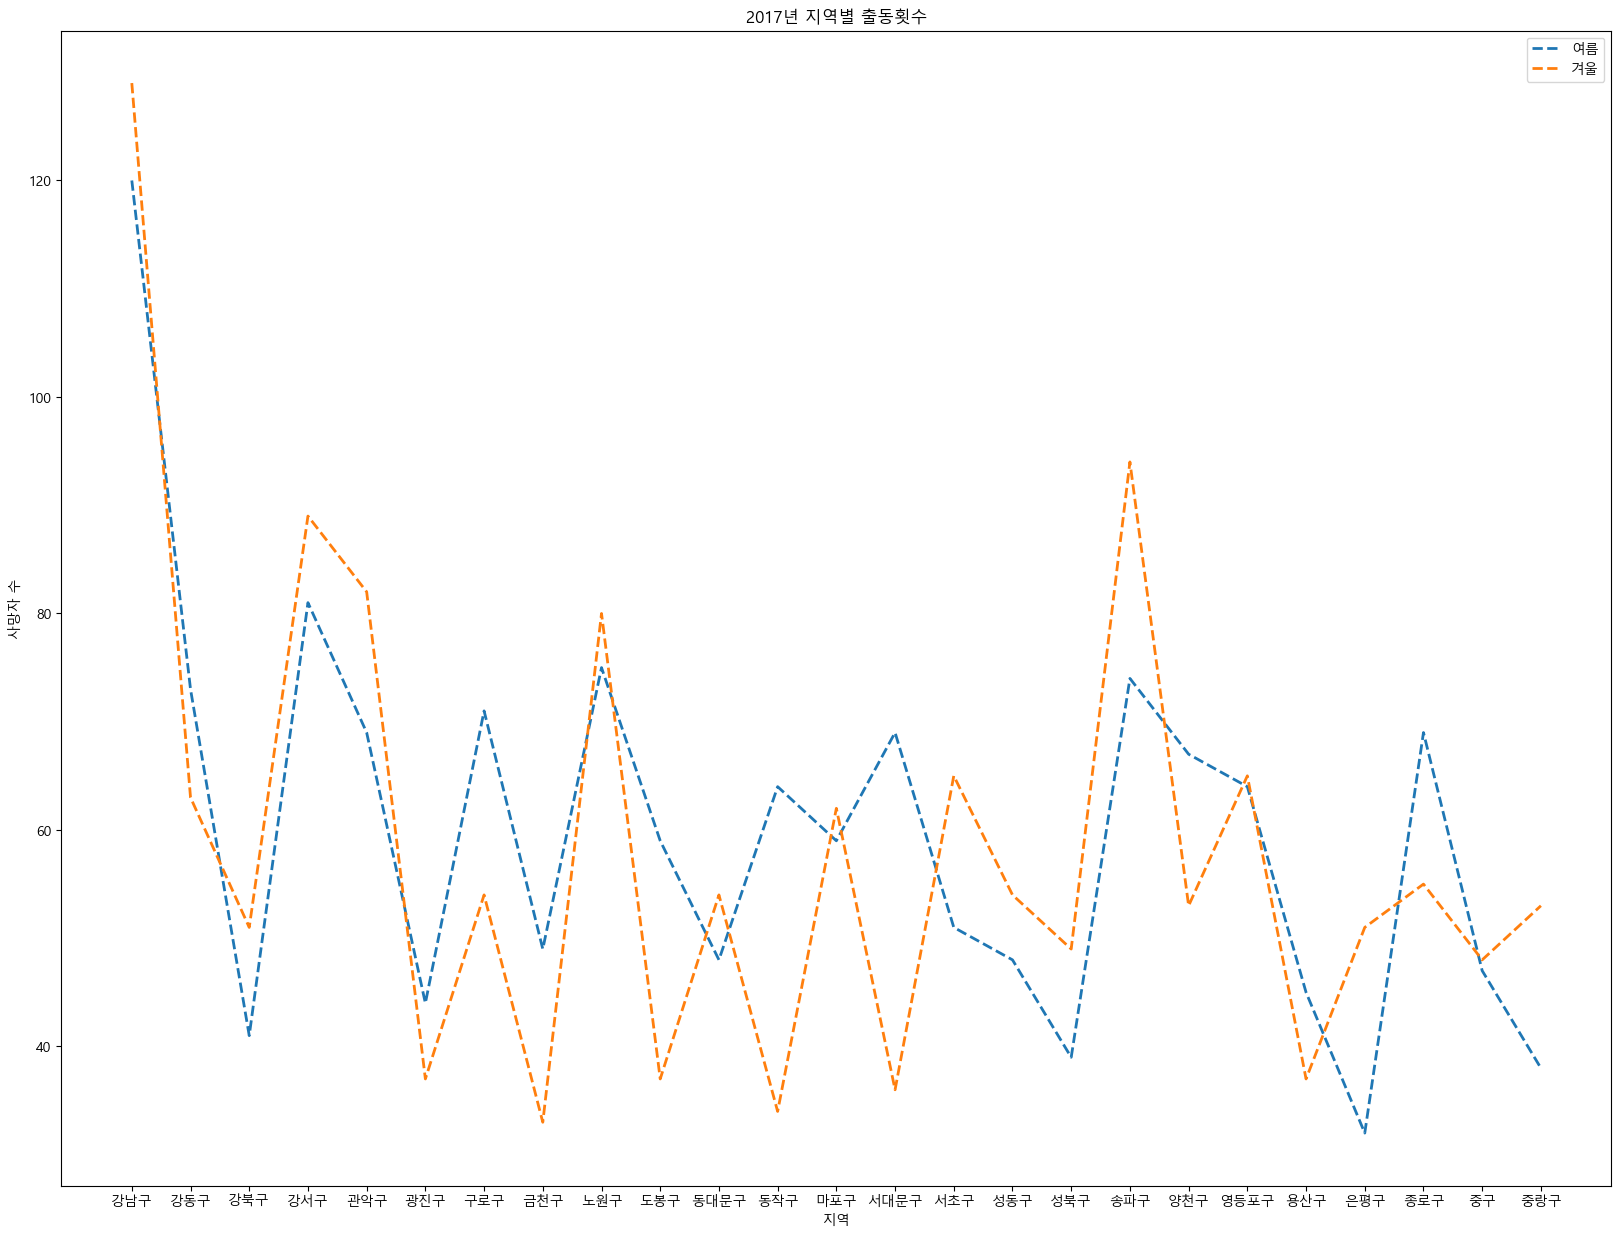
2017년 여름, 겨울 출동횟수 현황 선 그래프#
앞의 예시에서는 연도별로 총 출동횟수를 나타내었다. 이번 예시에서는 시군구별로 선 그래프에 색상을 적용하여 여름, 겨울의 출동 횟수를 연도별로 비교해보자. 가장 먼저 2017년의 선 그래프이다.
tmp_ind = final_dat["화재발생연도"] == 2017
sub_dat = final_dat.loc[tmp_ind, :]
sub_dat
| 화재발생연도 | 시군구 | 사망자수 | 부상자수 | 재산피해금액 | 총출동횟수 | 출동횟수_여름 | 출동횟수_겨울 | |
|---|---|---|---|---|---|---|---|---|
| 0 | 2017 | 강남구 | 0 | 11 | 1565258 | 502 | 120 | 129 |
| 1 | 2017 | 강동구 | 0 | 12 | 418593 | 269 | 73 | 63 |
| 2 | 2017 | 강북구 | 0 | 6 | 339146 | 186 | 41 | 51 |
| 3 | 2017 | 강서구 | 3 | 22 | 706871 | 364 | 81 | 89 |
| 4 | 2017 | 관악구 | 3 | 20 | 654690 | 286 | 69 | 82 |
| 5 | 2017 | 광진구 | 1 | 6 | 433742 | 200 | 44 | 37 |
| 6 | 2017 | 구로구 | 1 | 5 | 460568 | 260 | 71 | 54 |
| 7 | 2017 | 금천구 | 2 | 7 | 605549 | 174 | 49 | 33 |
| 8 | 2017 | 노원구 | 3 | 18 | 566821 | 279 | 75 | 80 |
| 9 | 2017 | 도봉구 | 2 | 6 | 288836 | 192 | 59 | 37 |
| 10 | 2017 | 동대문구 | 1 | 2 | 1122454 | 200 | 48 | 54 |
| 11 | 2017 | 동작구 | 3 | 10 | 277144 | 222 | 64 | 34 |
| 12 | 2017 | 마포구 | 1 | 7 | 1359029 | 235 | 59 | 62 |
| 13 | 2017 | 서대문구 | 1 | 15 | 397573 | 232 | 69 | 36 |
| 14 | 2017 | 서초구 | 2 | 13 | 695667 | 242 | 51 | 65 |
| 15 | 2017 | 성동구 | 1 | 11 | 621324 | 197 | 48 | 54 |
| 16 | 2017 | 성북구 | 1 | 8 | 400640 | 183 | 39 | 49 |
| 17 | 2017 | 송파구 | 3 | 13 | 639227 | 318 | 74 | 94 |
| 18 | 2017 | 양천구 | 0 | 7 | 300631 | 244 | 67 | 53 |
| 19 | 2017 | 영등포구 | 1 | 16 | 1093594 | 239 | 64 | 65 |
| 20 | 2017 | 용산구 | 0 | 6 | 262910 | 167 | 45 | 37 |
| 21 | 2017 | 은평구 | 0 | 3 | 218200 | 159 | 32 | 51 |
| 22 | 2017 | 종로구 | 1 | 3 | 1077665 | 234 | 69 | 55 |
| 23 | 2017 | 중구 | 5 | 14 | 485392 | 198 | 47 | 48 |
| 24 | 2017 | 중랑구 | 2 | 5 | 332366 | 196 | 38 | 53 |
fig = plt.figure(figsize=(20, 15))

plt.plot(sub_dat["시군구"], sub_dat["출동횟수_여름"], linestyle ="--", linewidth = 2)
plt.plot(sub_dat["시군구"], sub_dat["출동횟수_겨울"], linestyle ="--",linewidth = 2)

plt.legend([ "여름" , "겨울"], loc='upper right')

plt.title('2017년 지역별 출동횟수')
plt.xlabel('지역')
plt.ylabel('사망자 수')
plt.show()
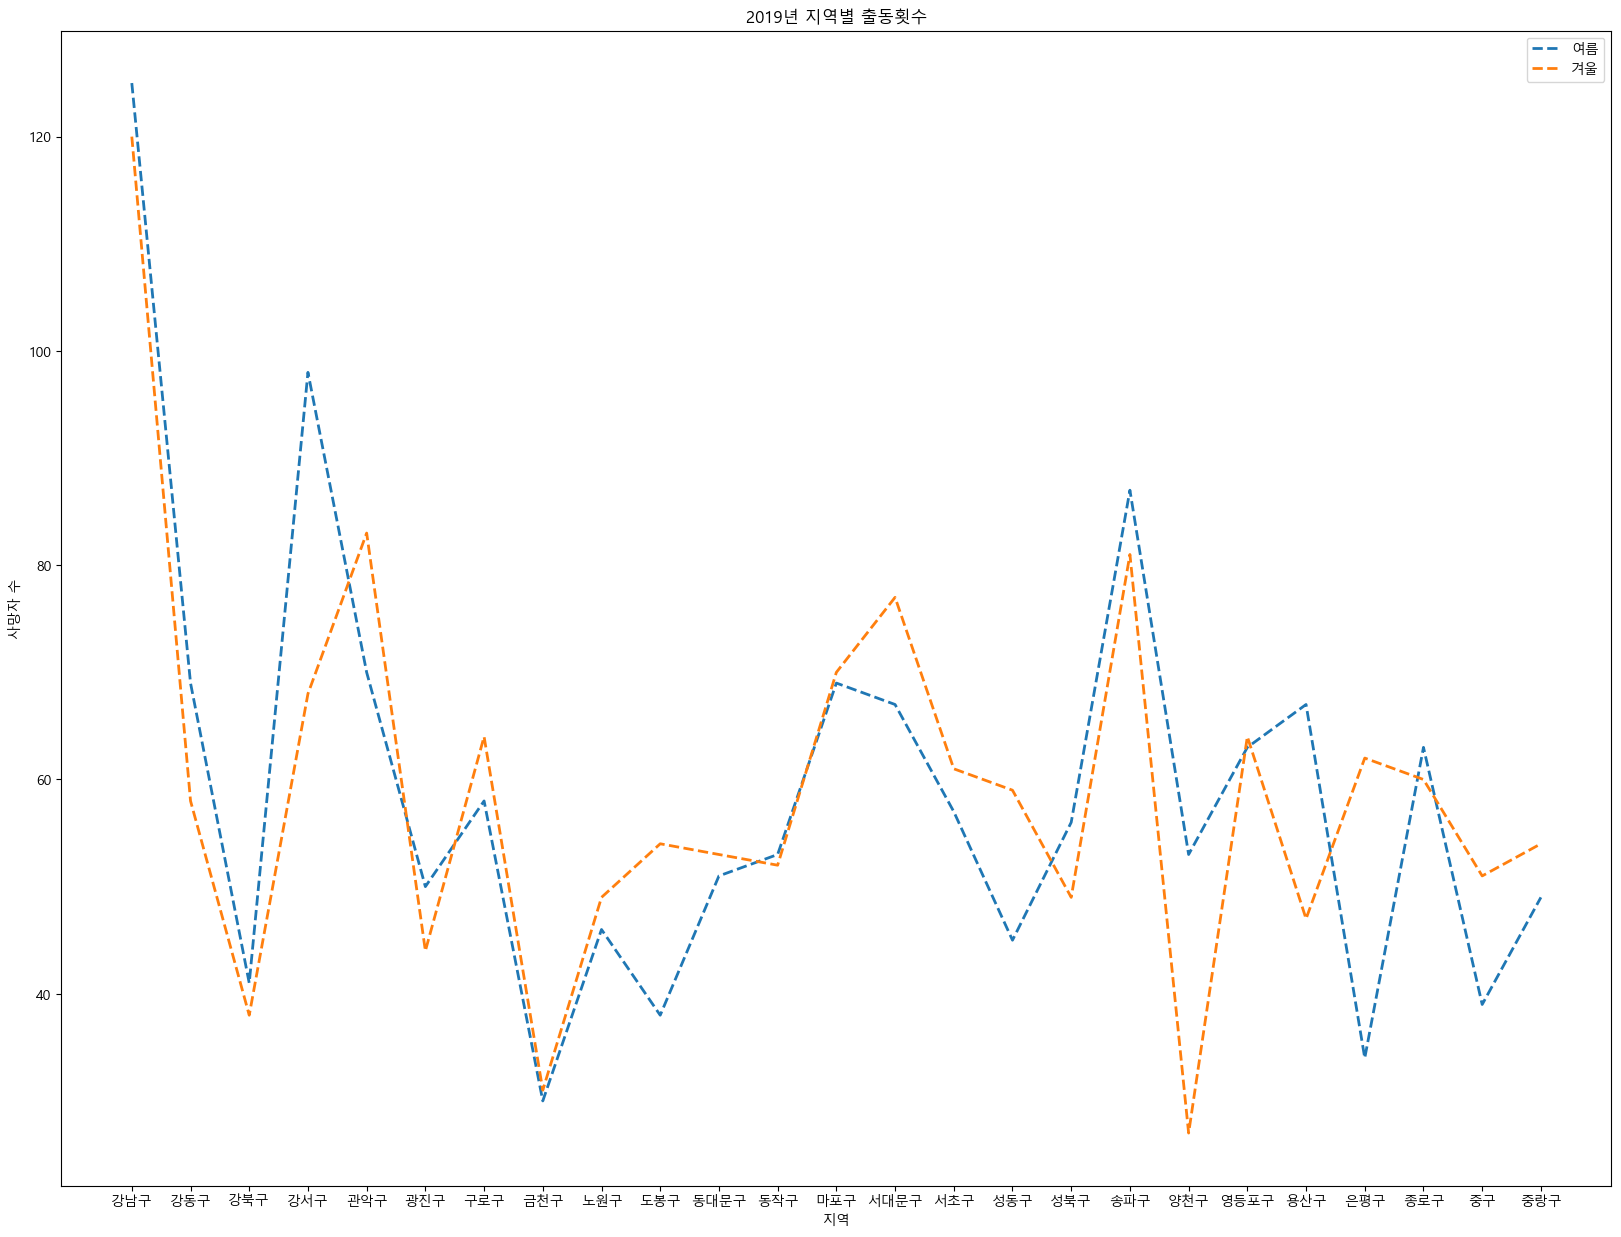
2019년 여름, 겨울 출동횟수 현황 선 그래프#
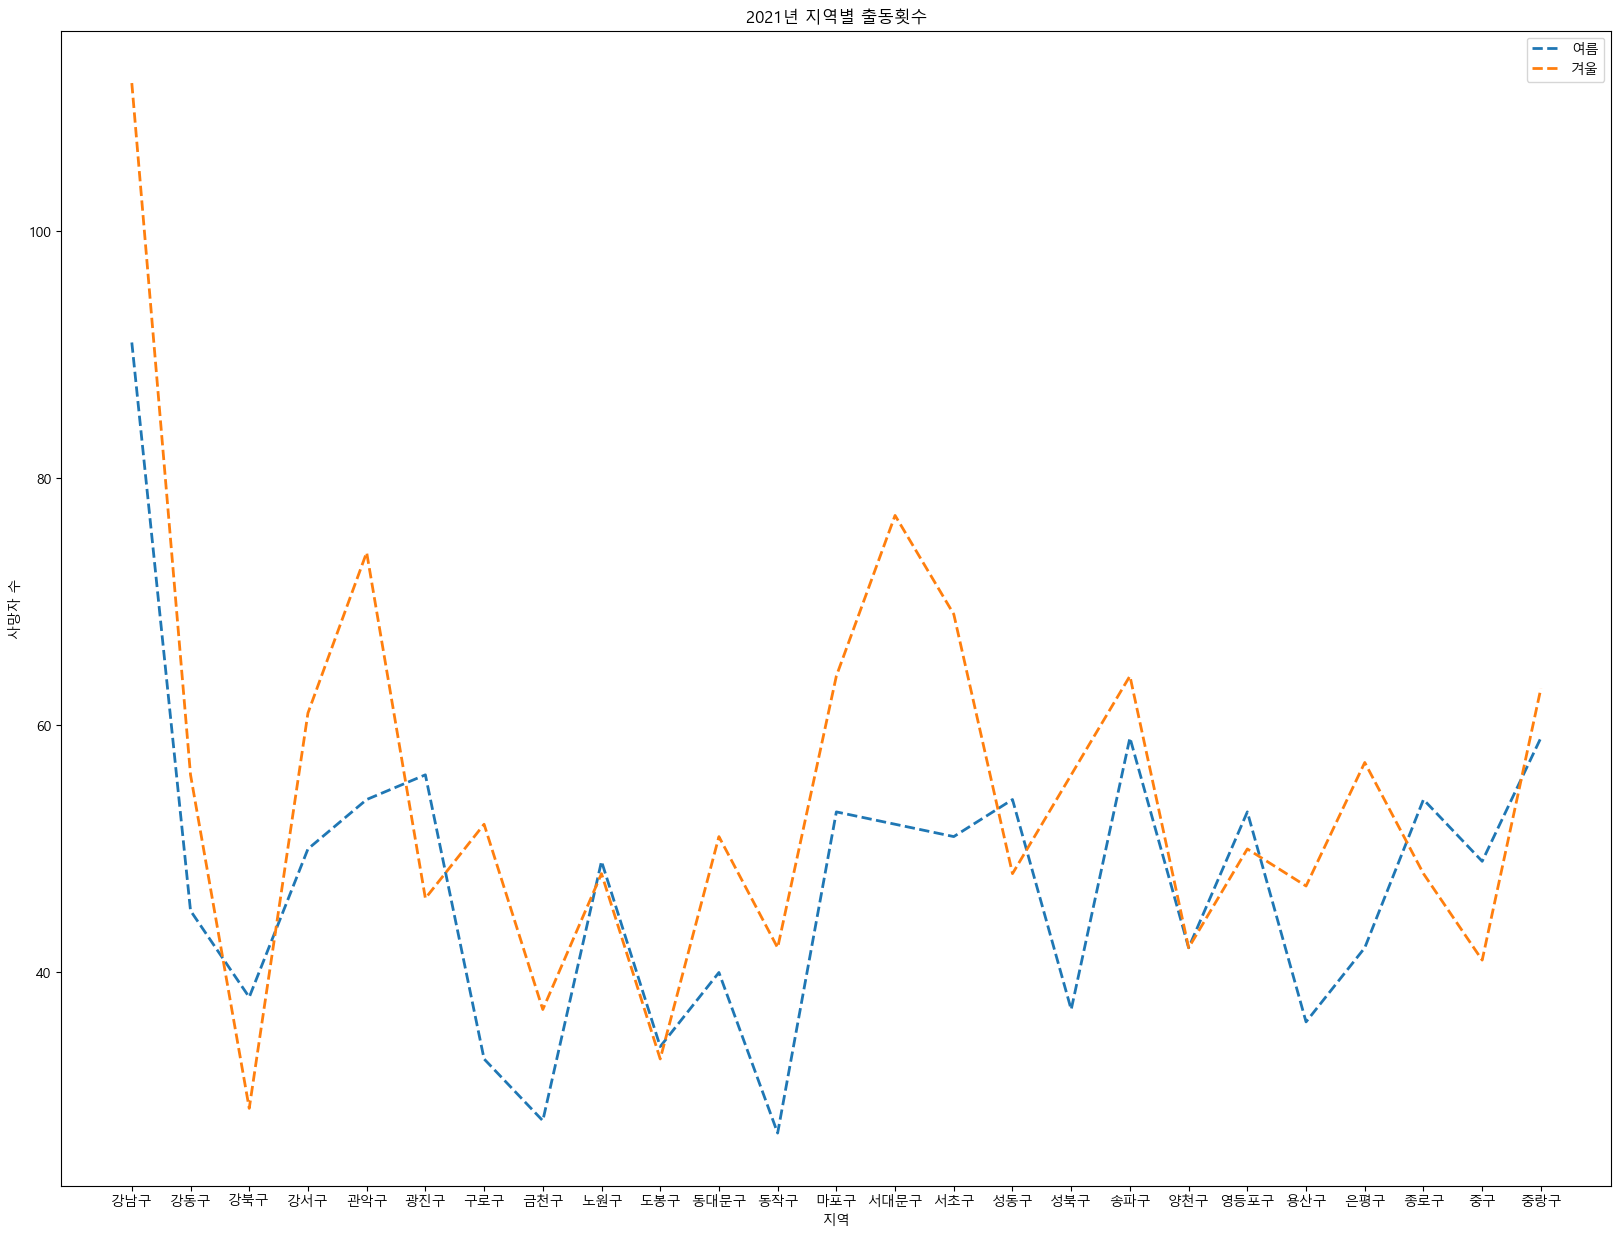
같은 방법으로 2019년, 2021년 그래프의 결과는 다음과 같다.
tmp_ind = final_dat["화재발생연도"] == 2019
sub_dat = final_dat.loc[tmp_ind, :]

fig = plt.figure(figsize=(20, 15))

plt.plot(sub_dat["시군구"], sub_dat["출동횟수_여름"], linestyle ="--", linewidth = 2)
plt.plot(sub_dat["시군구"], sub_dat["출동횟수_겨울"], linestyle ="--",linewidth = 2)

plt.legend([ "여름" , "겨울"], loc='upper right')

plt.title('2019년 지역별 출동횟수')
plt.xlabel('지역')
plt.ylabel('사망자 수')
plt.show()
2021년 여름, 겨울 출동횟수 현황 선 그래프#
tmp_ind = final_dat["화재발생연도"] == 2021
sub_dat = final_dat.loc[tmp_ind, :]

fig = plt.figure(figsize=(20, 15))

plt.plot(sub_dat["시군구"], sub_dat["출동횟수_여름"], linestyle ="--", linewidth = 2)
plt.plot(sub_dat["시군구"], sub_dat["출동횟수_겨울"], linestyle ="--",linewidth = 2)

plt.legend([ "여름" , "겨울"], loc='upper right')

plt.title('2021년 지역별 출동횟수')
plt.xlabel('지역')
plt.ylabel('사망자 수')
plt.show()
산점도#
산점도는 두 변수의 값을 하나의 점으로 표현하여 좌표평면에 나타내는 그래프이다. 그렇기에 두 변수의 관계를 살펴볼때 유용하게 사용된다.
이번 예시에서는 총출동횟수와 재산피해 금액, 부상자수에 대해 어떠한 관계가 존재하는지 산점도로 확인해보자.
2017년도 총 출동횟수와 재산피해금액, 부상자수에 대한 산점도#
final_dat
| 화재발생연도 | 시군구 | 사망자수 | 부상자수 | 재산피해금액 | 총출동횟수 | 출동횟수_여름 | 출동횟수_겨울 | |
|---|---|---|---|---|---|---|---|---|
| 0 | 2017 | 강남구 | 0 | 11 | 1565258 | 502 | 120 | 129 |
| 1 | 2017 | 강동구 | 0 | 12 | 418593 | 269 | 73 | 63 |
| 2 | 2017 | 강북구 | 0 | 6 | 339146 | 186 | 41 | 51 |
| 3 | 2017 | 강서구 | 3 | 22 | 706871 | 364 | 81 | 89 |
| 4 | 2017 | 관악구 | 3 | 20 | 654690 | 286 | 69 | 82 |
| ... | ... | ... | ... | ... | ... | ... | ... | ... |
| 120 | 2021 | 용산구 | 0 | 5 | 296793 | 176 | 36 | 47 |
| 121 | 2021 | 은평구 | 3 | 8 | 875722 | 160 | 42 | 57 |
| 122 | 2021 | 종로구 | 0 | 12 | 465499 | 192 | 54 | 48 |
| 123 | 2021 | 중구 | 0 | 16 | 2780374 | 171 | 49 | 41 |
| 124 | 2021 | 중랑구 | 1 | 12 | 345257 | 213 | 59 | 63 |
125 rows × 8 columns
fig = plt.figure(figsize=(15, 10))

tmp_ind = final_dat["화재발생연도"] == 2017
plt.scatter("총출동횟수", "재산피해금액", data = final_dat.loc[tmp_ind, :])

plt.title('2017년 산점도')
plt.xlabel('총출동횟수')
plt.ylabel('재산피해금액')

plt.show()
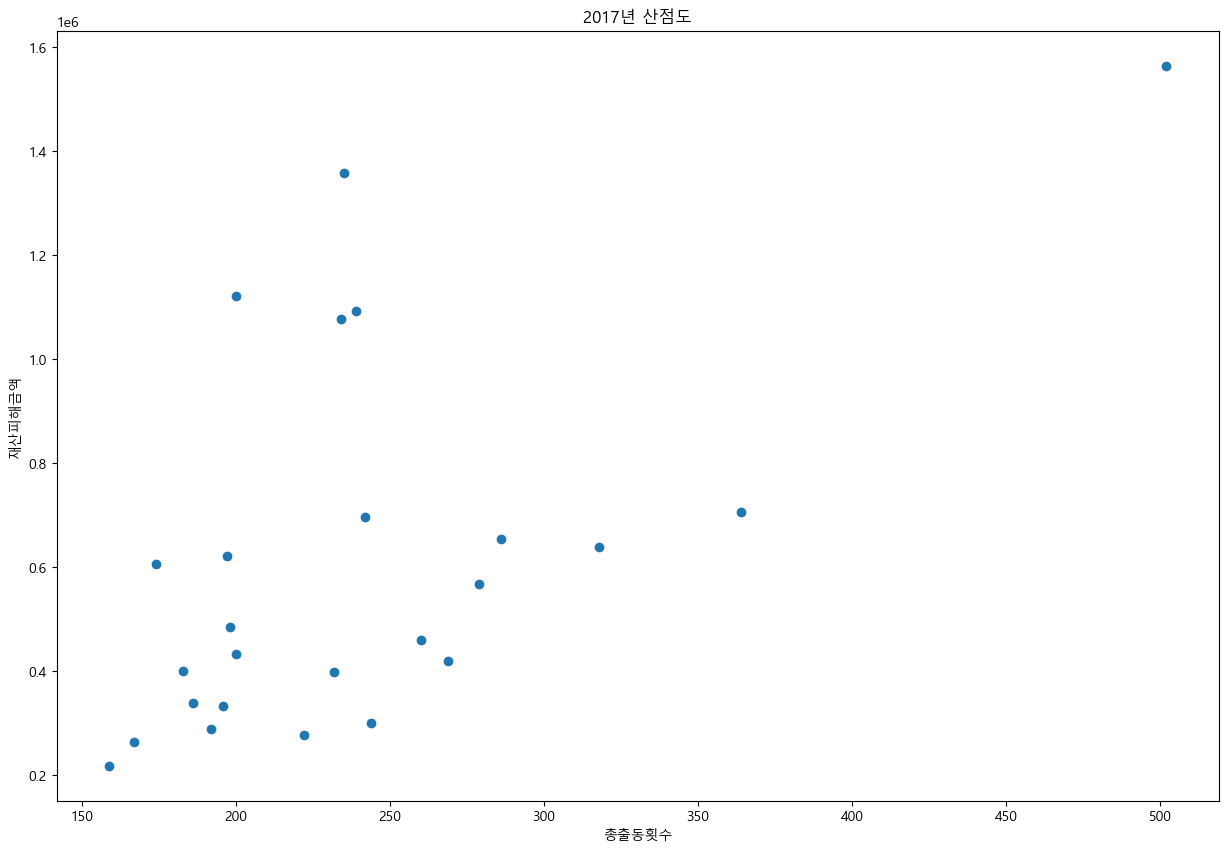
fig = plt.figure(figsize=(15, 10))

tmp_ind = final_dat["화재발생연도"] == 2017
plt.scatter("총출동횟수", "부상자수", data = final_dat.loc[tmp_ind, :])

plt.title('2017년 산점도')
plt.xlabel('총출동횟수')
plt.ylabel('부상자수')

plt.show()
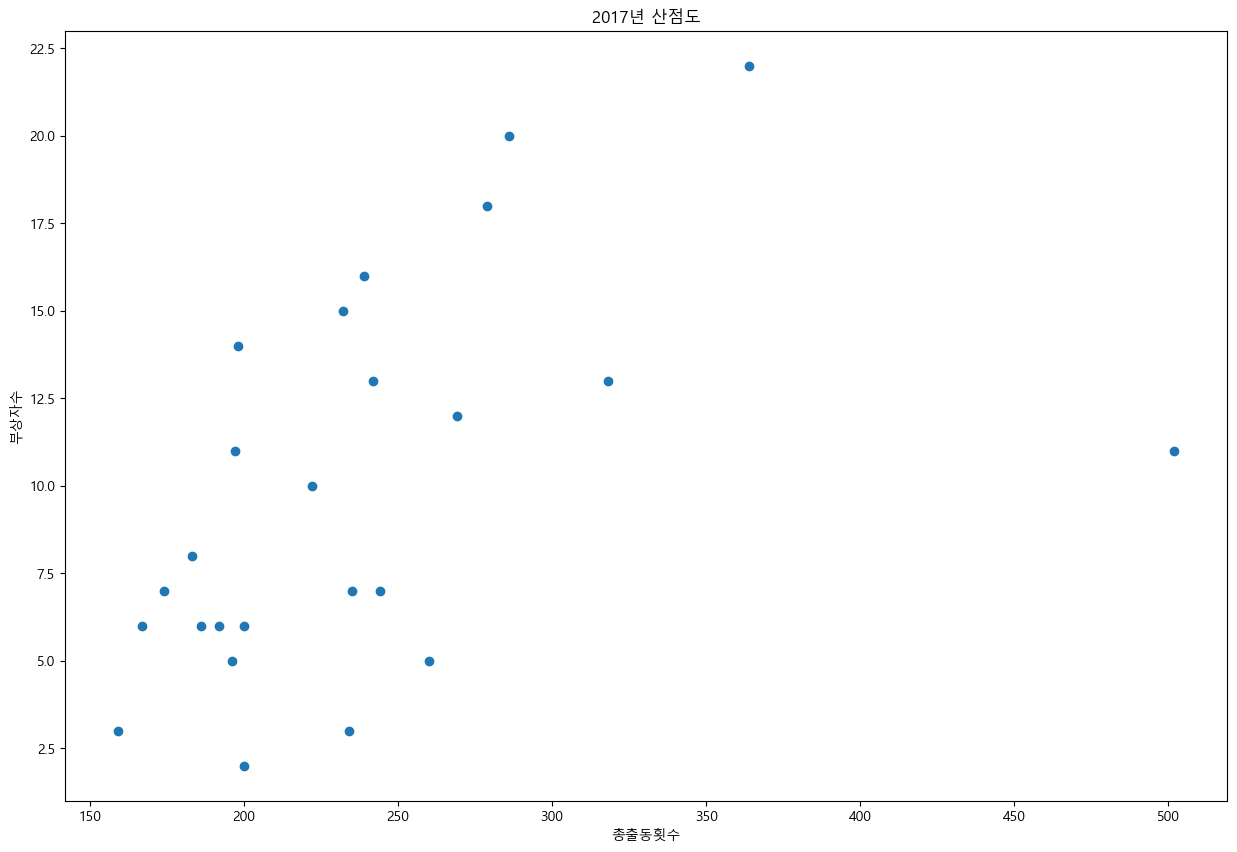
위 그래프를 보면, 2017년도에는 두 변수들 간에 증가하는 추세가 존재한다. 즉, 총 출동횟수가 증가한다면, 부상자수 혹은 재산피해금액 또한 증가하는 형태를 가지고 있다. 이를 2021년에 대해서도 살펴보자.
2021년도 총 출동횟수와 재산피해금액, 부상자수에 대한 산점도#
fig = plt.figure(figsize=(15, 10))

tmp_ind = final_dat["화재발생연도"] == 2021
plt.scatter("총출동횟수", "재산피해금액", data = final_dat.loc[tmp_ind, :])

plt.title('2021년 산점도')
plt.xlabel('총출동횟수')
plt.ylabel('재산피해금액')

plt.show()
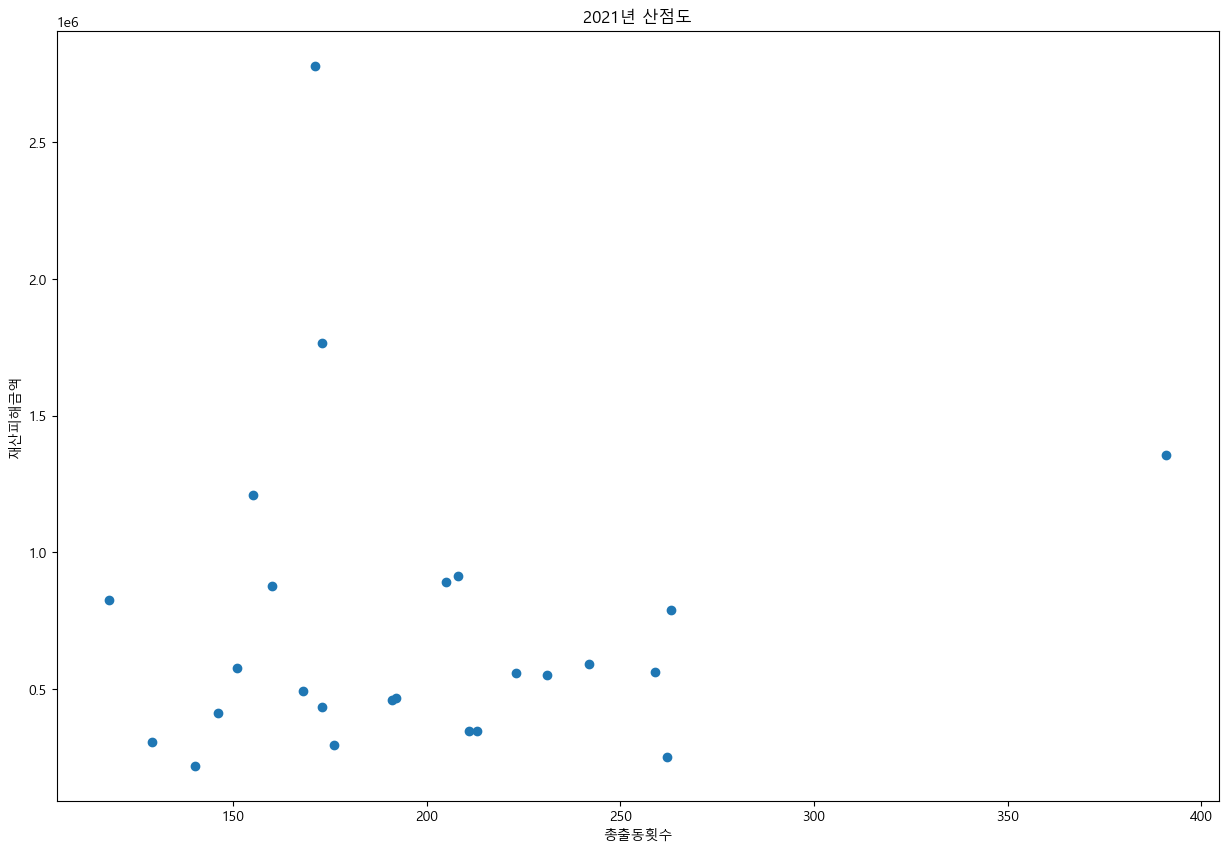
fig = plt.figure(figsize=(15, 10))

tmp_ind = final_dat["화재발생연도"] == 2021
plt.scatter("총출동횟수", "부상자수", data = final_dat.loc[tmp_ind, :])

plt.title('2021년 산점도')
plt.xlabel('총출동횟수')
plt.ylabel('부상자수')

plt.show()
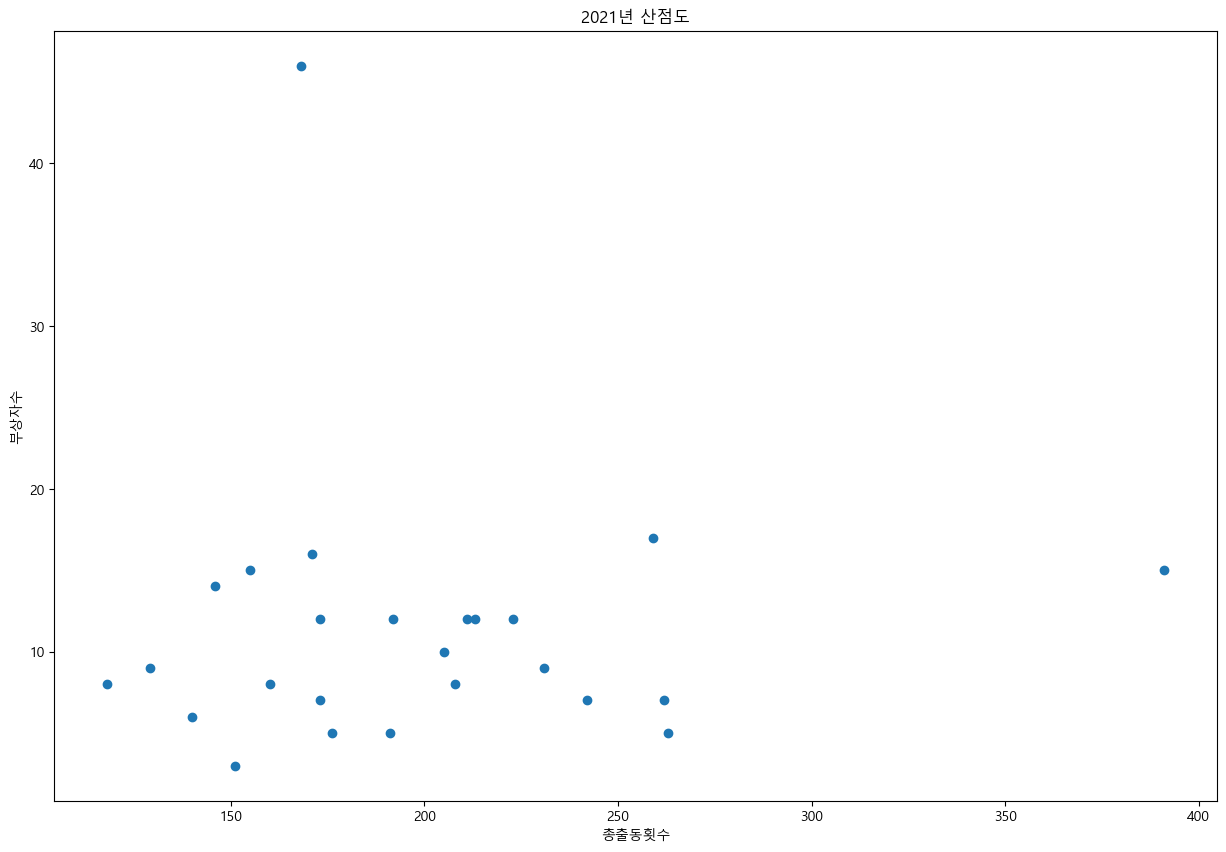
2021년의 경우, 2017년에 비해, 총출동횟수가 증가한다고 해서 부상자 수 및 재산피해금액이 증가하는 형태를 나타내지 않고 있다. 이러한 이유는 재산피해금액은 \(1.5*10^6\)이상, 부상자수에서는 30명 이상이 값이 1개 혹은 2개 밖에 존재하지 않는데, 이 값들에 의해 그래프의 모양이 망가지기 때문에 증가하는 형태가 눈에 띄지 않는것이다.
이러한 이상값들을 제거하고 살펴보면 다음과 같이 나타난다.
fig = plt.figure(figsize=(15, 10))

tmp_ind = (final_dat["화재발생연도"] == 2021) & (final_dat["재산피해금액"] <= 1.5*1e+6)
plt.scatter("총출동횟수", "재산피해금액", data = final_dat.loc[tmp_ind, :])

plt.title('2021년 산점도(이상점 제외)')
plt.xlabel('총출동횟수')
plt.ylabel('재산피해금액')

plt.show()
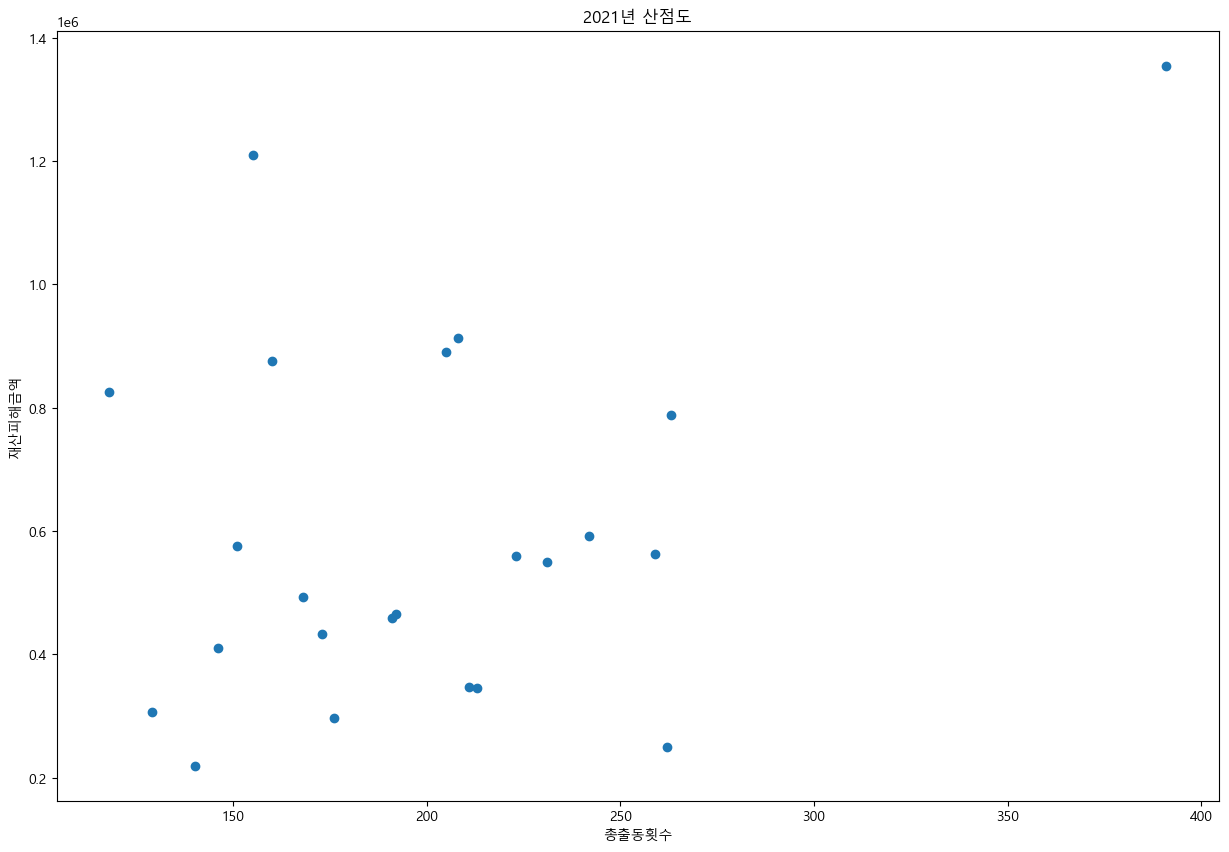
fig = plt.figure(figsize=(15, 10))

tmp_ind = (final_dat["화재발생연도"] == 2021) & (final_dat["부상자수"] <= 30)
plt.scatter("총출동횟수", "부상자수", data = final_dat.loc[tmp_ind, :])

plt.title('2021년 산점도(이상점 제외)')
plt.xlabel('총출동횟수')
plt.ylabel('부상자수')

plt.show()
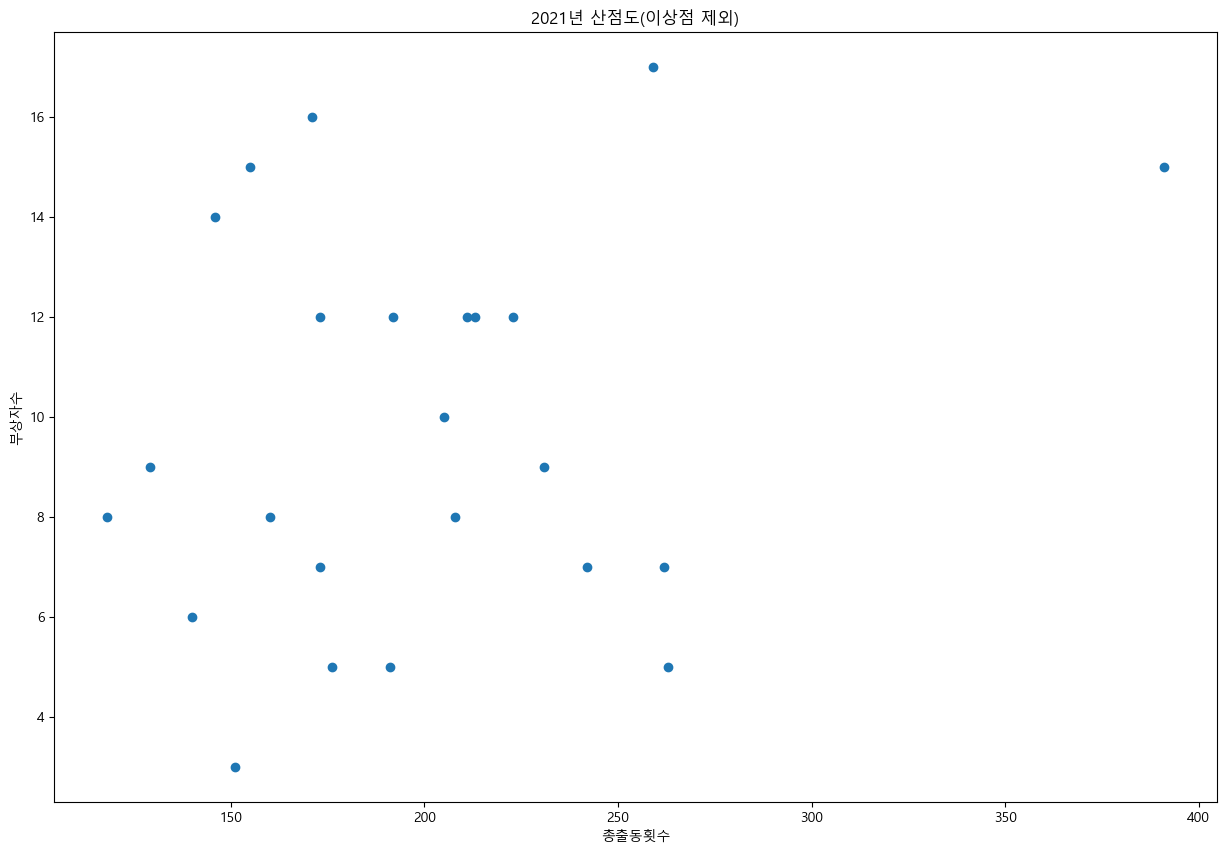
이상값들을 제거한 결과, 2017년에 비해 증가하는 추세가 존재하는 것 처럼 보이지 않는다. 즉, 2021년은 2017년에 비해 총 출동횟수는 감소하고, 나머지 두 변수에는 변화가 크지 않았지만, 두 변수간의 추세는 존재하지 않는다.